Horizontal wells#
A horizontal well is located in a 20 m thick aquifer; the hydraulic conductivity is \(k = 10\) m/d and the vertical anisotropy factor is 0.1. The horizontal well is placed 5 m above the bottom of the aquifer. The well has a discharge of 1000 m\(^3\)/d and radius of \(r=0.2\) m. The well is 200 m long and runs from \((x, y) = (−100, 0)\) to \((x, y) = (100, 0)\).
Three-dimensional flow to the horizontal well is modeled by dividing the aquifer up in
11 layers; the elevations are: [20, 15, 10, 8, 6, 5.5, 5.2, 4.8, 4.4, 4, 2, 0]. At
the depth of the well, the layer thickness is equal to the diameter of the well, and it
increases in the layers above and below the well. A transient timflow model is created with the
Model3D command. The horizontal well is located in layer 6 and is modeled with the
DitchString element.
import matplotlib.pyplot as plt
import numpy as np

import timflow.transient as tft

figsize = (6, 6)
# parameters
k = 10  # hydraulic conductivity, m/d
Ss = 1e-4  # specific storage, 1/m
anisotropy = 0.1  # kz / kh
z = [20, 15, 10, 8, 6, 5.5, 5.2, 4.8, 4.4, 4, 2, 0]  # top and bottoms of layers, m
ml = tft.Model3D(kaq=k, z=z, Saq=Ss, kzoverkh=anisotropy, tmin=0.1, tmax=100)
nls = 21
x = np.linspace(-100, 100, nls)
y = np.zeros(nls)
xy = np.vstack((x, y)).T
hw = tft.DitchString(
    ml, xy=xy, tsandQ=[(0, 1000)], layers=6
)  # horizontal well in layer 6
ml.solve()
self.neq  20
solution complete
h = ml.headgrid(
    np.linspace(-200, 200, 20),
    np.linspace(-100, 100, 20),
    t=[10, 20],
    layers=range(7),
    parallel=True,
    show_progress=True,
)
head array:   0%|          | 0/400 [00:00<?, ?it/s]
head array:   0%|          | 1/400 [00:03<24:14,  3.64s/it]
head array:  25%|██▌       | 101/400 [00:07<00:18, 16.40it/s]
head array:  50%|█████     | 201/400 [00:10<00:09, 21.55it/s]
head array:  75%|███████▌  | 301/400 [00:14<00:04, 24.06it/s]
head array: 100%|██████████| 400/400 [00:14<00:00, 27.72it/s]
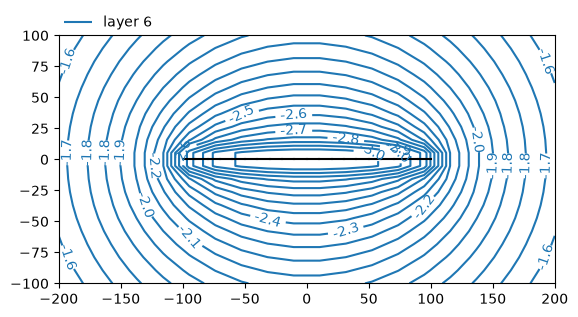
ml.plots.contour(win=[-200, 200, -100, 100], ngr=20, t=10, layers=6, parallel=True);
hw.headinside(20)[0] # returns heads in each line-sink (but they are all equal)
array([[-4.16010758]])
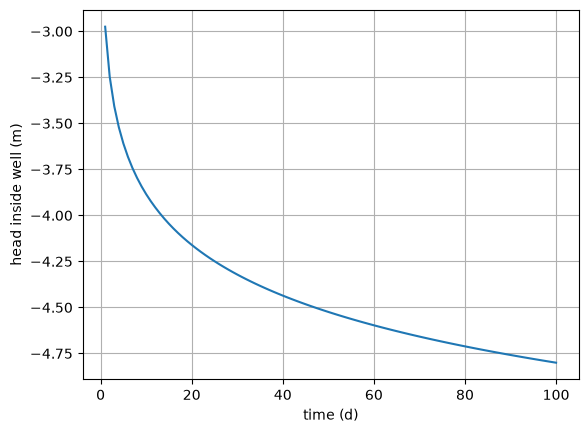
t = np.linspace(1, 100, 100)
hwinside = hw.headinside(t)
plt.plot(t, hwinside[0, 0])
plt.xlabel("time (d)")
plt.ylabel("head inside well (m)")
plt.grid()
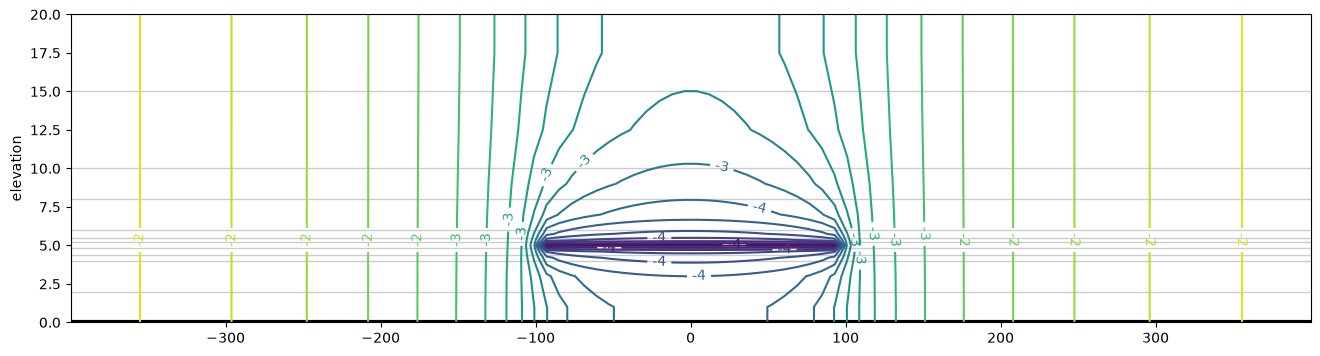
# contours in vertical cross-section. interpolation between cell centers
ax = ml.plots.vcontour(
    win=[-400, 400, 0, 0],
    n=100,
    t=50,
    levels=20,
    vinterp=True,
    figsize=(16, 4),
    horizontal_axis="x",
)
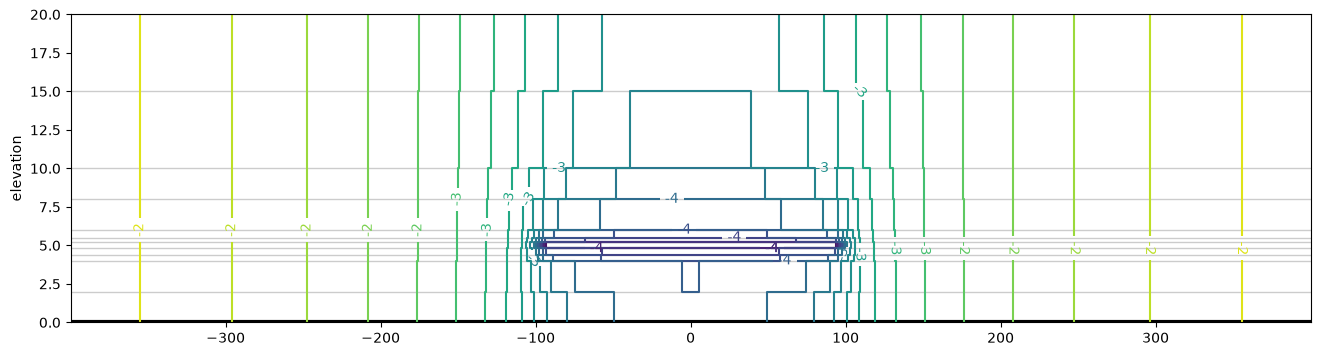
# contours in vertical cross-section. no interpolation between cell centers
ax = ml.plots.vcontour(
    win=[-400, 400, 0, 0],
    n=100,
    t=50,
    levels=20,
    vinterp=False,
    figsize=(16, 4),
    horizontal_axis="x",
)