Benchmark loading efficiency#
Comparison to results of Bakker (2016)#
import matplotlib.pyplot as plt
import numpy as np

import timflow.transient as tft
k = 20  # m/d
H = 10  # m
Ss = 1e-4  # 1/m
Sp = 0.1  # -
c = 500  # d
tsandhstar = [(0, 1)]
Figure 3#
def model(zland, leffaq=0, cland=1e12, Sland=Ss, land_top="conf"):
    ml = tft.ModelXsection(naq=1, tmin=1e-4, tmax=1e2)

    tft.XsectionMaq(
        model=ml,
        x1=-np.inf,  # river extends to infinitiy
        x2=0,
        z=[1, 0, -H],
        kaq=k,
        Saq=Ss,
        c=c,
        leffaq=leffaq,
        topboundary="semi",
        tsandhstar=tsandhstar,
        name="river",
    )

    tft.XsectionMaq(
        model=ml,
        x1=0,
        x2=np.inf,  # hinterland extends to infinity
        kaq=k,
        z=zland,
        Saq=Sland,
        c=cland,
        topboundary=land_top,
        name="land",
    )

    ml.solve()
    return ml
ml_leff = []
ml_noleff = []
# land is confined
ml_leff.append(model([0, -H], leffaq=1, Sland=Ss, land_top="conf"))
ml_noleff.append(model([0, -H], leffaq=0, Sland=Ss, land_top="conf"))
# land is semi-confined
ml_leff.append(model([1, 0, -H], leffaq=1, cland=c, Sland=Ss, land_top="semi"))
ml_noleff.append(model([1, 0, -H], leffaq=0, cland=c, Sland=Ss, land_top="semi"))
# land is phreatic
ml_leff.append(model([0, -H], leffaq=1, Sland=Sp, land_top="phre"))
ml_noleff.append(model([0, -H], leffaq=0, Sland=Sp, land_top="phre"))
self.neq  2
solution complete
self.neq  2
solution complete
self.neq  2
solution complete
self.neq  2
solution complete
self.neq  2
solution complete
self.neq  2
solution complete
x = np.linspace(-300, 300, 100)
t = [1 / 24, 1, 24]
plt.figure(figsize=(6, 6))
title = ["confined", "semi-confined", "unconfined"]
for i in range(len(ml_leff)):
    ha = ml_leff[i].headalongline(x, 0, t).squeeze()
    hb = ml_noleff[i].headalongline(x, 0, t).squeeze()
    ax = plt.subplot(3, 1, i + 1)
    legendtext = ["1 hr", "1 d", "24 d"]
    for it in range(len(t)):
        plt.plot(x, ha[it], color="C" + str(it), label=legendtext[it])
        plt.plot(x, hb[it], "--", color="C" + str(it))
    plt.axvline(0, linestyle=":", color="k")
    plt.xlim(-300, 300)
    plt.ylim(0, 1)
    plt.legend(loc="lower left", bbox_to_anchor=(1, 0.2), frameon=False)
    plt.ylabel("head (m)")
    plt.text(0.6, 0.7, title[i], transform=ax.transAxes)
    plt.text(1.05, 0.9, "loading eff = 1 (solid)", transform=ax.transAxes)
    plt.text(1.05, 0.75, "no loading eff (dashed)", transform=ax.transAxes)
    plt.grid()
plt.xlabel("x (m)")
plt.tight_layout()
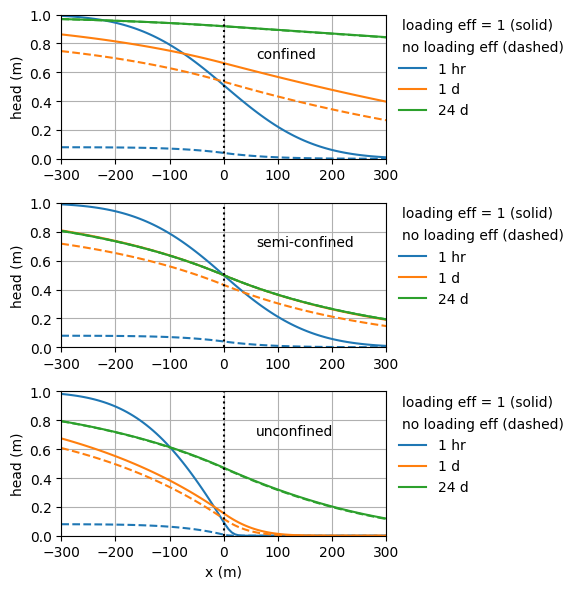
Figure 4#
t = np.logspace(-2, 2, 100)
x = [0, 100, 200]
plt.figure(figsize=(5.5, 6))
for i in range(len(x)):
    ax = plt.subplot(3, 1, i + 1)
    legendtext = ["confined", "semi-confined", "phreatic"]
    for im in range(len(ml_leff)):
        ha = ml_leff[im].head(x[i], 0, t).squeeze()
        hb = ml_noleff[im].head(x[i], 0, t).squeeze()
        plt.semilogx(t, ha, color="C" + str(im), label=legendtext[im])
        plt.semilogx(t, hb, "--", color="C" + str(im))
    plt.axvline(0, linestyle=":")
    plt.xlim(0.01, 100)
    plt.ylim(0, 1)
    plt.legend(loc="lower left", bbox_to_anchor=(1, 0.2), frameon=False)
    plt.ylabel("head (m)")
    plt.text(0.1, 0.85, f"at x={x[i]} m", transform=ax.transAxes)
    plt.text(1.05, 0.9, "loading eff = 1 (solid)", transform=ax.transAxes)
    plt.text(1.05, 0.75, "no loading eff (dashed)", transform=ax.transAxes)
    plt.grid()
plt.xlabel("time (d)")
plt.tight_layout()
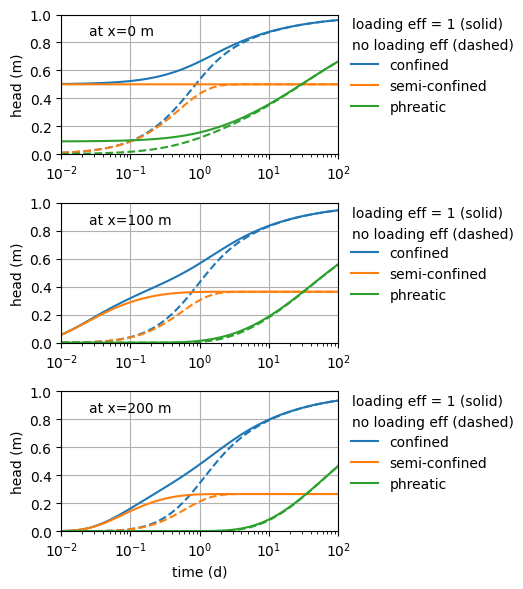
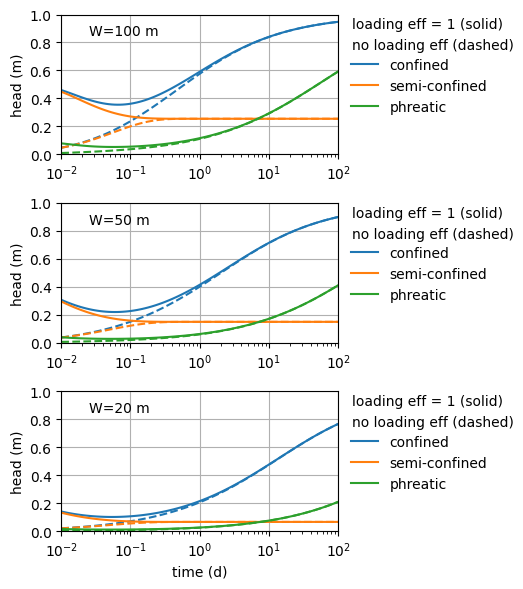
Figure 6#
k = 20  # m/d
H = 10  # m
Ss = 1e-4  # 1/m
Sp = 0.1  # -
c = 100  # d
tsandhstar = [(0, 1)]
def model(zland, leffaq=0, cland=1e12, Sland=Ss, land_top="conf", W=20):
    ml = tft.ModelXsection(naq=1, tmin=1e-4, tmax=1e2)

    tft.XsectionMaq(
        model=ml,
        x1=-W / 2,  # river extends to infinitiy
        x2=W / 2,
        z=[1, 0, -H],
        kaq=k,
        Saq=Ss,
        c=c,
        leffaq=leffaq,
        topboundary="semi",
        tsandhstar=tsandhstar,
        name="river",
    )

    tft.XsectionMaq(
        model=ml,
        x1=-np.inf,
        x2=-W / 2,  # hinterland extends to infinity
        kaq=k,
        z=zland,
        Saq=Sland,
        c=cland,
        topboundary=land_top,
        name="left",
    )

    tft.XsectionMaq(
        model=ml,
        x1=W / 2,
        x2=np.inf,  # hinterland extends to infinity
        kaq=k,
        z=zland,
        Saq=Sland,
        c=cland,
        topboundary=land_top,
        name="right",
    )

    ml.solve()
    return ml
def create_models(W=20):
    ml_leff = []
    ml_noleff = []
    # land is confined
    ml_leff.append(model([0, -H], leffaq=1, Sland=Ss, land_top="conf", W=W))
    ml_noleff.append(model([0, -H], leffaq=0, Sland=Ss, land_top="conf", W=W))
    # land is semi-confined
    ml_leff.append(
        model(
            [1, 0, -H],
            leffaq=1,
            cland=c,
            Sland=Ss,
            land_top="semi",
            W=W,
        )
    )
    ml_noleff.append(
        model(
            [1, 0, -H],
            leffaq=0,
            cland=c,
            Sland=Ss,
            land_top="semi",
            W=W,
        )
    )
    # land is phreatic
    ml_leff.append(model([0, -H], leffaq=1, Sland=Sp, land_top="phreatic", W=W))
    ml_noleff.append(model([0, -H], leffaq=0, Sland=Sp, land_top="phreatic", W=W))
    return ml_leff, ml_noleff
W = [100, 50, 20]
t = np.logspace(-2, 2, 100)
plt.figure(figsize=(5.5, 6))
for i in range(len(W)):
    ml_leff, ml_noleff = create_models(W[i])
    ax = plt.subplot(3, 1, i + 1)
    legendtext = ["confined", "semi-confined", "phreatic"]
    for im in range(len(ml_leff)):
        ha = ml_leff[im].head(W[i] / 2, 0, t).squeeze()
        hb = ml_noleff[im].head(W[i] / 2, 0, t).squeeze()
        plt.semilogx(t, ha, color="C" + str(im), label=legendtext[im])
        plt.semilogx(t, hb, "--", color="C" + str(im))
    plt.axvline(0, linestyle=":")
    plt.xlim(0.01, 100)
    plt.ylim(0, 1)
    plt.legend(loc="lower left", bbox_to_anchor=(1, 0.2), frameon=False)
    plt.ylabel("head (m)")
    plt.text(0.1, 0.85, f"W={W[i]} m", transform=ax.transAxes)
    plt.text(1.05, 0.9, "loading eff = 1 (solid)", transform=ax.transAxes)
    plt.text(1.05, 0.75, "no loading eff (dashed)", transform=ax.transAxes)
    plt.grid()
plt.xlabel("time (d)")
plt.tight_layout()
self.neq  4
solution complete
self.neq  4
solution complete
self.neq  4
solution complete
self.neq  4
solution complete
self.neq  4
solution complete
self.neq  4
solution complete
self.neq  4
solution complete
self.neq  4
solution complete
self.neq  4
solution complete
self.neq  4
solution complete
self.neq  4
solution complete
self.neq  4
solution complete
self.neq  4
solution complete
self.neq  4
solution complete
self.neq  4
solution complete
self.neq  4
solution complete
self.neq  4
solution complete
self.neq  4
solution complete
Reference#
Bakker, M., 2016. The effect of loading efficiency on the groundwater response to water level changes in shallow lakes and streams. Water Resources Research, 52(3), pp.1705-1715, https://doi.org/10.1002/2015WR017977.