
Test line-sink strings#
This notebook tests line-sink string elements.
import matplotlib.pyplot as plt

import timflow.steady as tfs
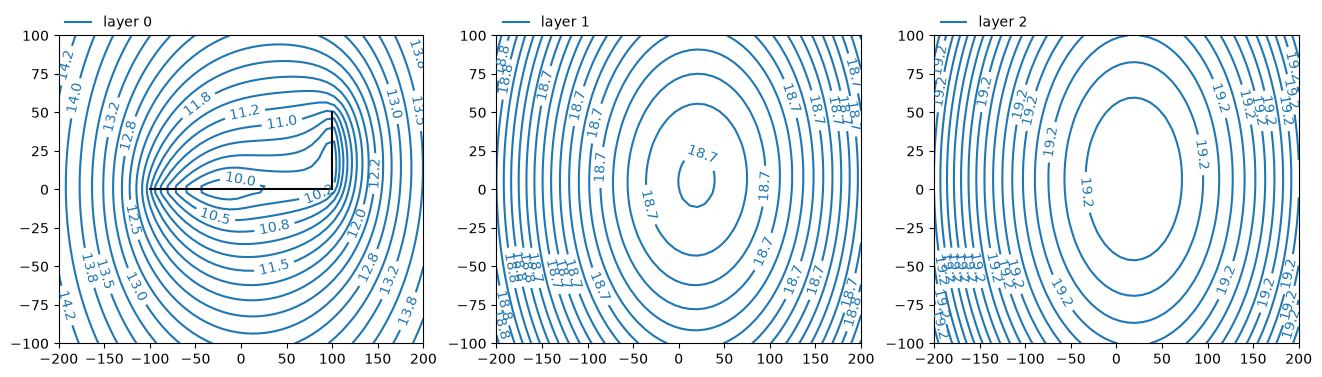
One RiverString in one layer#
ml = tfs.ModelMaq(kaq=[10, 20, 5], z=[0, -20, -40, -80, -90, -140], c=[4000, 10000])
rf = tfs.Constant(ml, xr=0, yr=10000, hr=20, layer=0)
ls1 = tfs.RiverString(ml, xy=[(-100, 0), (0, 0), (100, 0), (100, 50)], hls=10, layers=0)
ml.solve()
Number of elements, Number of equations: 2 , 4
.
.

solution complete
plt.figure(figsize=(16, 4))
for i in range(3):
    ax = plt.subplot(1, 3, i + 1)
    ml.plots.contour([-200, 200, -100, 100], ngr=50, layers=i, ax=ax)
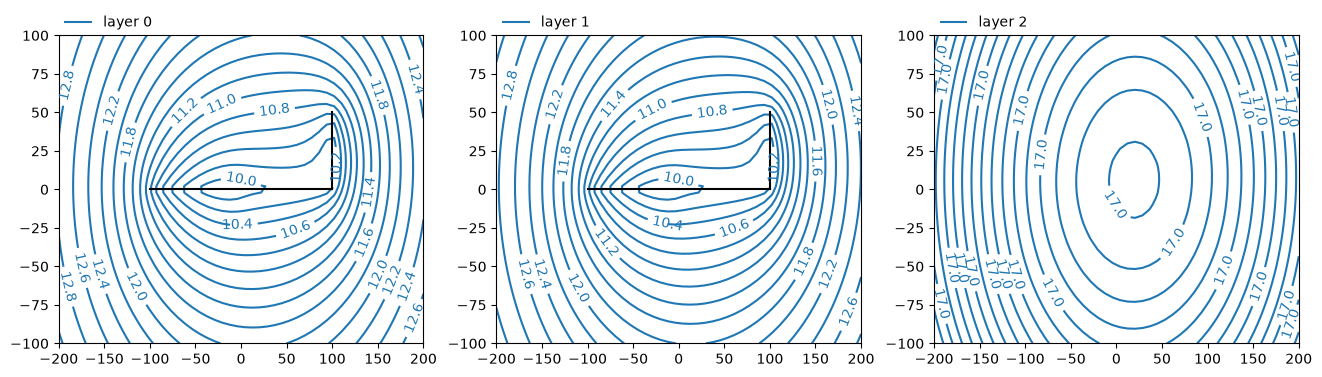
RiverString in two layers#
ml = tfs.ModelMaq(kaq=[10, 20, 5], z=[0, -20, -40, -80, -90, -140], c=[4000, 10000])
rf = tfs.Constant(ml, xr=0, yr=10000, hr=20, layer=0)
ls1 = tfs.RiverString(
    ml, xy=[(-100, 0), (0, 0), (100, 0), (100, 50)], hls=10, layers=[0, 1]
)
ml.solve()
Number of elements, Number of equations: 2 , 7
.
.

solution complete
plt.figure(figsize=(16, 4))
for i in range(3):
    ax = plt.subplot(1, 3, i + 1)
    ml.plots.contour([-200, 200, -100, 100], ngr=50, layers=i, ax=ax)
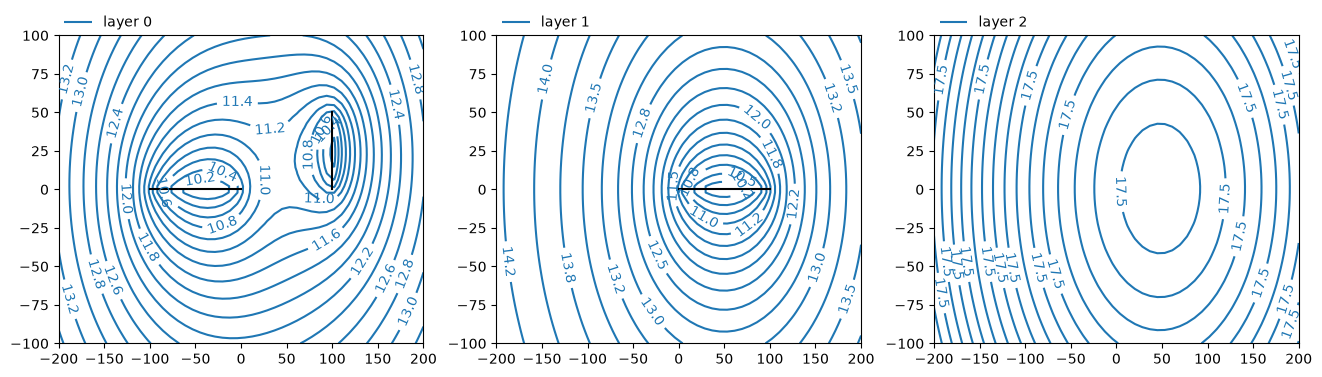
RiverString, each section in different layer#
ml = tfs.ModelMaq(kaq=[10, 20, 5], z=[0, -20, -40, -80, -90, -140], c=[4000, 10000])
rf = tfs.Constant(ml, xr=0, yr=10000, hr=20, layer=0)
ls1 = tfs.RiverString(
    ml, xy=[(-100, 0), (0, 0), (100, 0), (100, 50)], hls=10, layers=[0, 1, 0]
)
ml.solve()
Number of elements, Number of equations: 2 , 4
.
.

solution complete
plt.figure(figsize=(16, 4))
for i in range(3):
    ax = plt.subplot(1, 3, i + 1)
    ml.plots.contour([-200, 200, -100, 100], ngr=50, layers=i, ax=ax)
A 2D array (NLS, NLAYERS)#
Layers can always be specified as a 2D array.
ml = tfs.ModelMaq(kaq=[10, 20, 5], z=[0, -20, -40, -80, -90, -140], c=[4000, 10000])
rf = tfs.Constant(ml, xr=0, yr=10000, hr=20, layer=0)
ls1 = tfs.RiverString(
    ml,
    xy=[(-100, 0), (0, 0), (100, 0), (100, 50)],
    hls=10,
    layers=[[0, 1], [0, 1], [0, 1]],
)
ml.solve()
Number of elements, Number of equations: 2 , 7
.
.

solution complete
plt.figure(figsize=(16, 4))
for i in range(3):
    ax = plt.subplot(1, 3, i + 1)
    ml.plots.contour([-200, 200, -100, 100], ngr=50, layers=i, ax=ax)